
If you were forced to step away from your company for thirty days, would it continue to generate wealth or would it collapse under the weight of manual errors? You have likely reached a plateau where more effort no longer equals more profit. It is a dangerous state of stagnation. You are exhausted by role confusion and the mental drain of micro-decisions. Business process visualization is not a simple documentation exercise; it is the tactical audit of your freedom. If you cannot see the process, you cannot own the outcome.
You understand that manual workflows are a tax on your growth. This guide provides the 2026 blueprint to map your operations, expose hidden bottlenecks, and reclaim your time. We will analyze the frameworks needed to identify automation opportunities and transition from a founder-led grind to a systemized machine that runs without you. It is time to stop playing the game on hard mode and build a business that operates on autopilot.
Key Takeaways
- Expose the invisible workflows that act as a silent tax on your growth and the primary driver of founder burnout.
- Master the anatomy of high-performance mapping by identifying the precise decision points and outputs that define your wealth engine.
- Utilize 2026 tactical tools to transform business process visualization from a passive exercise into a high-stakes audit of your operational efficiency.
- Follow a 5-step blueprint to prioritize high-stress bottlenecks and set clear boundaries that prevent scope creep from stalling your progress.
- Learn why you must never automate a broken process and how to identify the specific "low-hanging fruit" that will finally put your business on autopilot.
Why Your Invisible Workflows Are the Silent Killers of Growth
Is your business a scalable asset or a high-stress job you've created for yourself? Most founders operate in a state of perpetual "doing," where the steps required to generate revenue exist only as frantic impulses in their own minds. This is the founder trap. If your operations aren't documented, they aren't real. Business process visualization is the graphical representation of your wealth engine. It transforms the abstract chaos of your daily tasks into a tangible, inspectable map. Without this map, you aren't a CEO; you're a firefighter with no exit strategy.
In 2026, the stakes have shifted. We're no longer in an era where "hustle" is the primary competitive advantage. If you cannot visualize your workflows, you cannot leverage the power of AI or advanced automation. Machines require logic. They require clear inputs and defined outputs. If your process is invisible, it's un-automatable. You're essentially paying a "chaos tax" every single day you refuse to map your path to freedom. Business process mapping provides the clarity needed to stop the leak and start the scale.
The High Cost of Operational Blindness
How much money is slipping through the cracks of your unmapped workflows? Operational blindness leads to massive leakage in time, focus, and capital. When a process is invisible, redundant steps hide in the shadows, eating your profit margins while your team waits for instructions that only you can provide. This creates a bottleneck that stops your revenue at whatever level your personal bandwidth can handle. Visualization provides the psychological relief of moving from guessing to seeing. Once the map's in front of you, the solution becomes obvious. You stop wondering why growth has stalled and start identifying exactly which cog in the machine is broken.
Visualization as the Foundation of Wealth
Investors and sophisticated buyers don't pay for your hustle. They pay for documented, visualized systems that generate predictable results. If the business relies on your presence to function, it has no terminal value. It's just a lifestyle business. By visualizing your processes, you create a blueprint that allows the business to scale without a linear increase in staff. This is the first critical step in your business system implementation journey. You're building a machine that generates wealth on autopilot, protecting your future and securing your legacy. If you want to own your time, you must first own your processes.
The Anatomy of a High-Performance Process Map
Most founders treat their company like a black box. You pour in capital and effort, then cross your fingers that profit comes out the other side. This is not leadership; it's gambling. To build a business that generates wealth on autopilot, you must understand the skeletal structure of your operations. A high-performance map isn't a drawing. It's a diagnostic tool that exposes exactly where your revenue engine is smoking. If you can't name the input, you don't own the output.
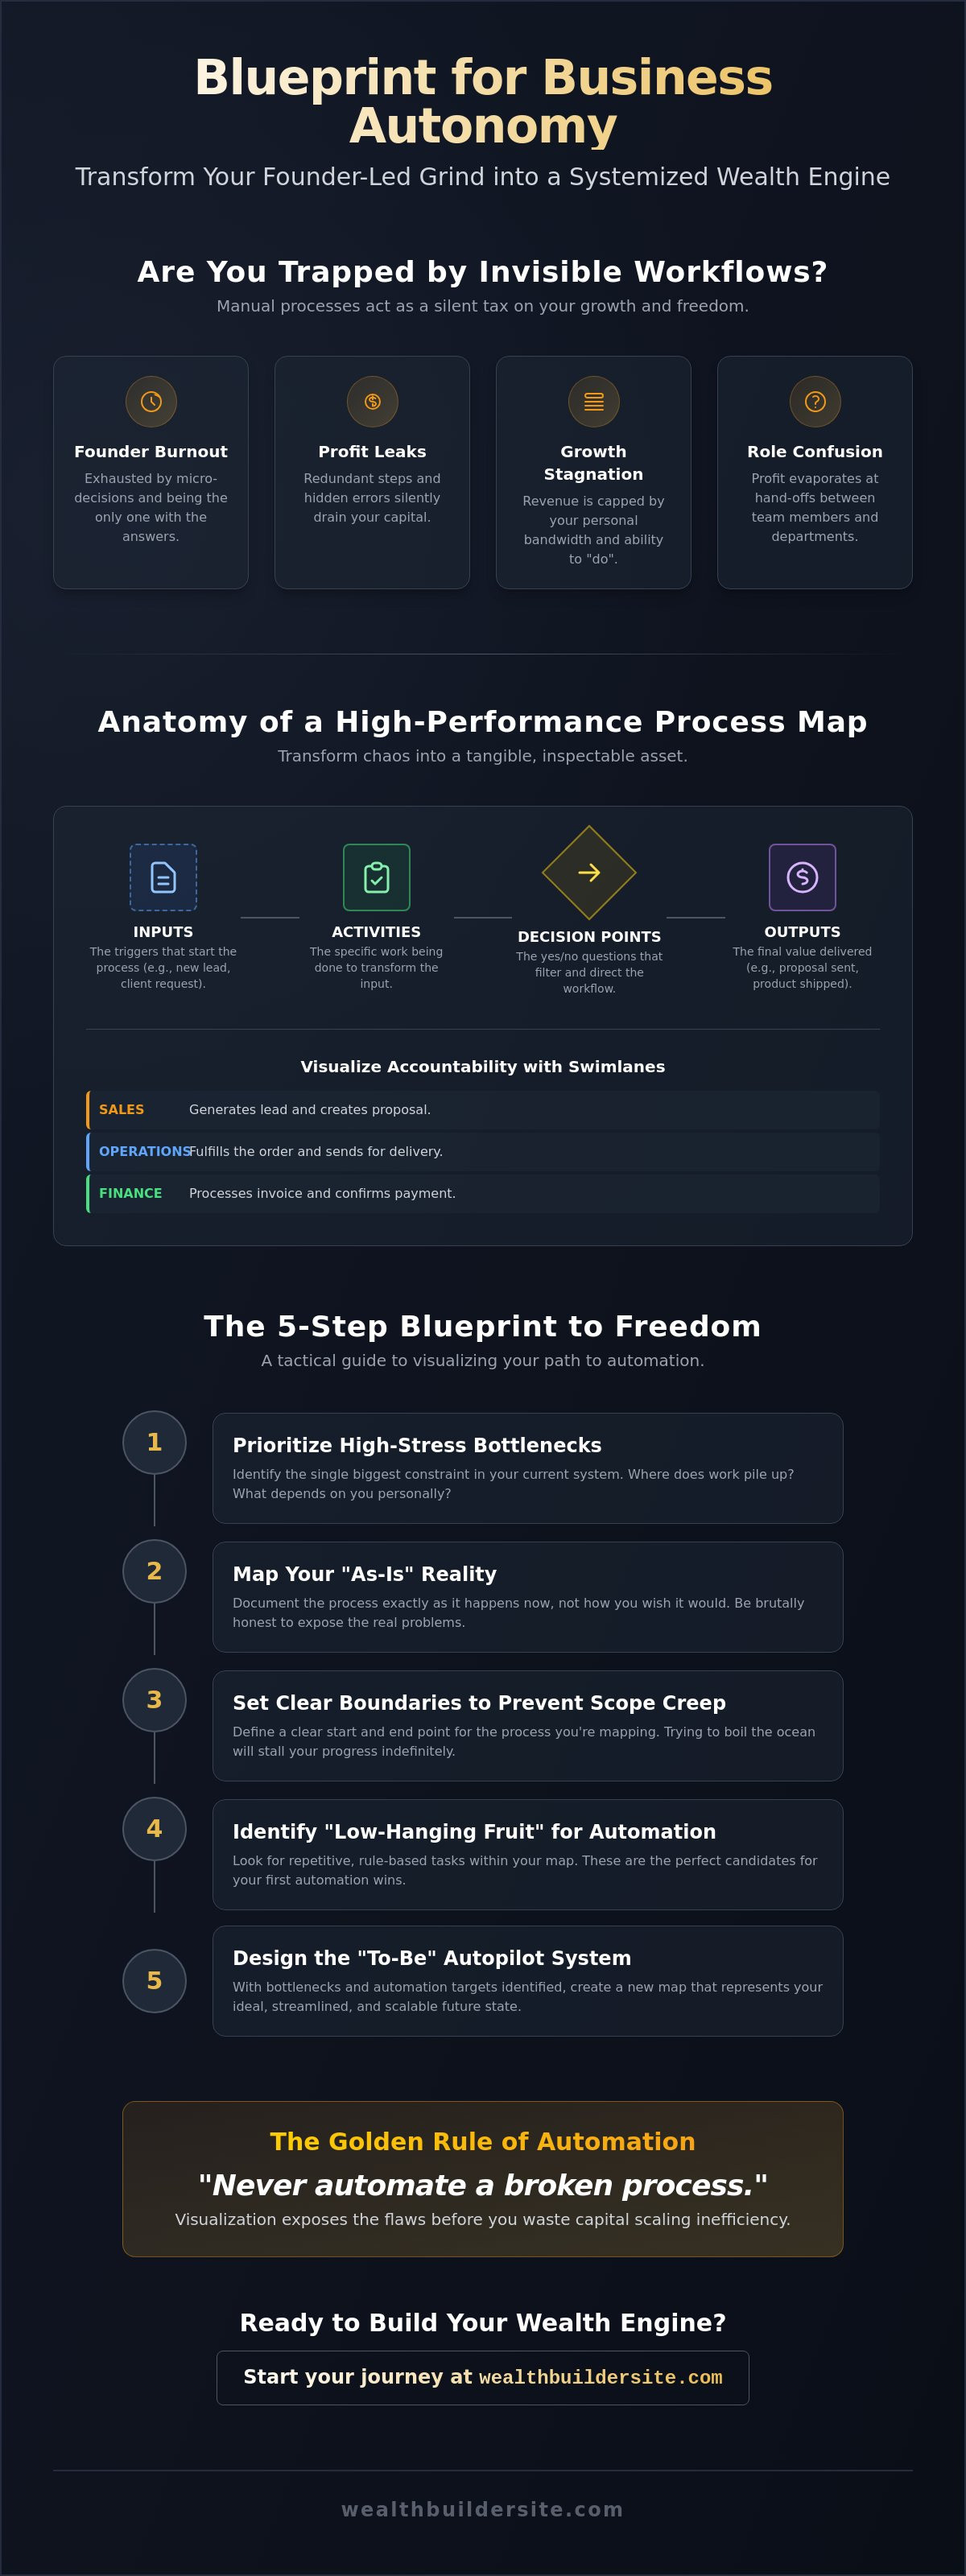
The core of business process visualization relies on four pillars: Inputs (the triggers), Activities (the work), Decision Points (the filters), and Outputs (the value). You must be brutally honest about your "As-Is" map. This is your current reality, warts and all. Most entrepreneurs make the mistake of mapping their "To-Be" goal before they've even admitted how broken their current system is. If you lie to your map, you're lying to your future. Research on the Effectiveness of Business Process Visualisations confirms that clear graphical representations are the only way to reduce cognitive load and find the "wealth leaks" in your strategy. These leaks usually happen at the "Hand-offs." When a task moves from one person to another, profit often evaporates through role confusion and delays.
Key Symbols and Notation for Entrepreneurs
You don't need a degree in computer science to master this. The global standard is BPMN 2.0.2, but for your purposes, simplicity wins. Use "Swimlanes" to divide your map into horizontal rows, with each row representing a specific team member or department. This creates immediate accountability by showing exactly who holds the ball at any given moment. Standardized symbols ensure that every team member interprets the workflow identically, which eliminates the friction of cross-team confusion and mismanaged expectations.
Identifying the "Critical Path"
Every business has a sequence of steps that dictates the speed of revenue. This is your Critical Path. If you're bogged down in administrative noise, you're slowing down your wealth generation. Visualization allows you to separate core value-add activities from the fluff that should be delegated or deleted. More importantly, it reveals the "single point of failure." If your map shows every decision point leading back to your desk, you've identified the bottleneck. It is you. If you're ready to stop being the bottleneck and start building a real wealth-engine, joining our Business Workshop is the next logical step for your transformation.
Choosing Your Weapon: Techniques and Tools for 2026
Stop treating your business like a hobby. If you're still sketching workflows on a dry-erase board or a static PDF, you're already losing the game. The evolution of business process visualization has moved from simple drawings to dynamic, AI-generated process mining. Manual mapping is useful for initial brainstorming, but it's prone to "founder's bias." You often map what you think happens, not the messy reality of what actually occurs. Automated discovery uses real data to show you the truth. If you want to scale without chaos, you need tools that provide a tactical audit of your reality rather than a polished fantasy.
What is the actual ROI of your online business tools? If they don't facilitate real-time collaboration, they're dead weight. Your team must be able to edit and optimize the map as the market evolves. A process map that sits in a digital drawer is a documentation exercise, not a growth strategy. You need a living document that serves as the single source of truth for every role in your organization. If your team isn't looking at the map daily, the map doesn't exist.
Top Visualization Frameworks
Choosing the right framework is a strategic decision, not an aesthetic one. Flowcharts are the baseline for simple, linear administrative tasks where the path is clear. If you're focused on high-level strategy, utilize SIPOC (Supplier, Input, Process, Output, Customer) to ensure every activity aligns with the final value delivered to your client. For those obsessed with efficiency, Value Stream Mapping remains the gold standard for identifying waste and removing the friction that eats your margins.
The 2026 Tool Stack
Start with lightweight, collaborative platforms like Miro or Lucidchart to capture the initial "As-Is" state of your operations. These are excellent for getting the logic out of your head and onto a screen. As your complexity increases, transition to data-heavy platforms where you can Visualize processes in Power Automate to see exactly where your team is stalling in real-time. Finally, you must integrate these visual maps with your business automation software. Mapping without automation is a waste of time; automation without mapping is simply a way to make mistakes faster. Fix the process visually first, then let the machines take over the heavy lifting.
The 5-Step Blueprint to Visualizing Your Path to Freedom
Are you attempting to document every minor task in your company? If so, you're treating this like a school project rather than a strategic offensive. You don't have the luxury of time for a total inventory. You need to apply the 80/20 rule to your business process visualization efforts immediately. Identify the 20% of workflows that generate 80% of your revenue, or more importantly, the 20% that cause 80% of your operational friction. If you don't prioritize by pain, you're just drawing pictures while your margins bleed out. You must define clear boundaries with a fixed start and end point for every map. Without these guardrails, scope creep will turn a simple audit into a never-ending cycle of over-analysis.
Step 1 & 2: Strategy and Scope
Setting measurable goals is the difference between a useful system and a digital paperweight. Don't just "map the process." Instead, set a target to reduce onboarding time by 30% or cut error rates by half. This gives your visualization a financial purpose. You must also assign clear "Process Ownership" from day one. If no one is responsible for the accuracy of the map, it will be ignored the moment the market shifts. You're building a wealth engine, not a museum exhibit. Every line you draw must serve the ultimate goal of reclaiming your time and increasing your profit.
Step 3, 4 & 5: Execution and Refinement
Do not ask your managers how the work gets done. They'll give you the idealized version found in an outdated handbook. You must gather the ground truth from the people in the trenches. Shadowing a process is the only way to see the hidden manual workarounds your team has invented to survive your current lack of structure. Once you have a draft, run a "Stress Test" by pushing a live transaction through the model. If the map doesn't hold up under pressure, it's a fantasy, not a system. You must optimize the map by cutting redundant steps before you even look at a piece of software.
This refinement phase is the bridge to scaling business without employees by using lean leverage and high-level systems. If you're tired of being the only person who knows how your business actually works, it's time to professionalize your operations. Stop guessing at your growth and start engineering it. If you are ready to take the next step toward true operational freedom, join our Business Workshop to master these frameworks in a high-stakes environment.
From Visualization to Automation: Building Your Wealth Engine
Do you think software is the magic wand that will solve your operational chaos? It isn't. If you automate a broken process, it doesn't get fixed; it just breaks faster and at a higher volume. You can't code your way out of a fundamental logic problem. Business process visualization is the filter that prevents you from wasting capital on expensive software that simply accelerates your inefficiency. You must refine the engine before you install the turbocharger. If the logic of your map is flawed, the automation will simply scale your mistakes until they become fatal.
In 2026, the elite don't just have static documents. They have a Digital Twin of their operation. This is a live, visual representation of your business that allows you to run "what-if" scenarios without risking your actual cash flow. It is the ultimate manifestation of the tactical audit. By maintaining this level of clarity, you move from being a laborer in your business to being the architect of a wealth-generating machine. This level of systemization is the non-negotiable prerequisite for those seeking elite status in our community. If you cannot map it, you cannot master it.
Audit Your Map for Automation
Look at your visual map. Every node that represents a repetitive, rule-based task is a candidate for software intervention. These are your "low-hanging fruit." You must calculate the potential ROI of automating each specific node by measuring the hours reclaimed versus the cost of implementation. Apply the "Delete, Delegate, Automate" framework with total ruthlessness. If a step doesn't add value, delete it. If it requires a human touch but not yours, delegate it. Only when a process is lean and logical should you hand it over to a machine.
Your Next Step Toward Mastery
Visualization is merely the entry point of your transformation. It is the foundation upon which true Money Mastery is built. You have spent enough time guessing at your growth and hoping for a breakthrough. It is time to stop playing the game on hope and start playing on a proven system. You are either the architect of your freedom or a slave to your own lack of structure. The choice is yours, but the market will not wait for you to decide. Join WealthBuilders University to turn your maps into a wealth-generating machine and finally build the business you were meant to lead.
Master Your Machine or Remain Its Slave
If you leave your business processes in your head, you're building a prison, not a legacy. You've seen how invisible workflows act as a silent tax on your growth. You now understand that high-performance mapping is the only way to expose the single points of failure that keep you trapped in the daily grind. Business process visualization isn't just about drawing lines; it's about reclaiming your time and securing your financial future through data-backed systems that generate wealth on autopilot.
The choice is simple. You can continue to hustle through the chaos or you can implement the curated frameworks used by elite entrepreneurs to scale without burnout. We provide results-oriented coaching for high-level professionals ready to transition from laborer to architect. The market doesn't reward effort; it rewards systems that produce predictable outcomes. Stop guessing and start scaling. Explore WealthBuilders University today. Your roadmap to true operational freedom is ready. It's time to execute.
Frequently Asked Questions
What is the difference between a process map and a flowchart?
A flowchart is a simple sequence of steps; a process map is a strategic diagnostic tool. While a flowchart tells you what happens next, business process visualization through mapping identifies inputs, outputs, and specific accountability through swimlanes. If you are only drawing boxes, you are documenting a task. If you are mapping, you are auditing the logic of your wealth engine to find where profit is leaking.
Do I need expensive software to start business process visualization?
You don't need a high-priced subscription to fix a broken logic. While professional tools like Microsoft Visio Plan 1 start at $5 per user per month, you can begin the process with a simple whiteboard or a collaborative tool like Miro. The tool is irrelevant if you haven't done the hard work of thinking through your workflows. Don't use a lack of software as an excuse to remain in operational chaos.
How often should I update my business process maps?
Update your maps the moment a process changes or at least every quarter during a tactical audit. A static map is a dead map that leads to role confusion and manual errors. If your business is evolving and you aren't updating your blueprint, you are scaling on a foundation of outdated assumptions. Treat your maps as living documents that reflect the current reality of your operations.
Can business process visualization help with employee training?
Visualization is the ultimate shortcut for onboarding and team clarity. By providing a visual SOP, you reduce the time spent on repetitive explanations and prevent new hires from inheriting the "hidden" manual workarounds of their predecessors. If your team has a clear map, they can execute with precision without requiring your constant intervention. It transforms your staff from reactive helpers into systemized operators.
What are the most common mistakes when mapping business processes?
The most fatal mistake is mapping a "fantasy" version of your business instead of the messy reality. Founders often document how they wish things worked rather than how they actually function in the trenches. Another common error is failing to define clear start and end points, which leads to scope creep. If you lie to your map about the current state of your workflows, you'll never find the bottlenecks killing your growth.
How do I know if a process is too complex to visualize?
If a process feels too complex to draw, it is too complex to scale. Complexity is usually a mask for inefficiency or a lack of clear decision points. When you encounter a convoluted workflow, break it down into smaller sub-processes rather than trying to map the entire machine at once. If you can't visualize it simply, you don't understand it well enough to automate it or delegate it effectively.
Is business process visualization relevant for a one-person business?
Mapping is even more critical for solopreneurs because it's the only way to prepare for future delegation. You are currently the bottleneck in every single process of your company. By visualizing your workflows now, you create the blueprints required to hire your first employee or implement automation. If you don't map the machine while you're small, you'll be trapped inside it as you grow.
How does visualization improve my business valuation?
Visualization proves to investors and buyers that your company is a sellable asset rather than a founder-dependent job. Sophisticated buyers look for documented, predictable systems that generate results regardless of who is at the helm. When you can show a clear, visualized map of your operations, you reduce the perceived risk for a buyer. You aren't just selling a revenue stream; you're selling a proven wealth-generating machine.